An open-source library that evaluates distance between songs
Index
What is Bliss?
Bliss is a library used to compute distance between two songs. It can be useful for creating « intelligent » playlists, for instance, and is used as such in leleleplayer and Blissify.
The main algorithm works by outputing a vector V = (a,b,c,d) for each song. The euclidean distance between these vectors corresponds to the actual distance felt by listening to them: a playlist can then be built by queuing close songs, or do other stuff using mathematical tools available on euclidean 4-dimensionnal spaces.
Bliss is written in C, uses ffmpeg, and its source code is also available on Github. Like leleleplayer, it's still in development, so don't hesitate to make contributions, bug reports and bugfixes!
Library usage
Once installed (see below), use the -lbliss compilator flag, and don't forget to #include <bliss.h> to your code.
You can then use the following functions:
bl_cosine_similarity_file()andbl_cosine_similarity()to compute the cosine similarity of two songsbl_distance_file()andbl_distance()to compute the distance bewteen two songs
Functions postfixed by "_file" takes a filename as arguments; the other take struct song as arguments. A struct song is obtained by using the bl_audio_decode() function, and contains some information about the song: number of samples, title...
There are also Python bindings that can be set up and used this way. Thanks to Phyks and fossfreedom for the creation and testing of these bindings!
Download
64-bits packages and shared dll are available for Archlinux, Debian/Ubuntu and Windows.
You can also build it from source (see below), or make a package for your distro!
Build from source
If you don't use our packages, or if there is no package available for your operationg system, you can still build Bliss from source, given that you have FFmpeg installed on your system.
Then, execute the following:
		$ git clone https://github.com/Polochon-street/bliss.git # Retrieve the source

		$ cd bliss # Go to the created directory

		$ mkdir build && cd build # Create and enter the build directory

		$ cmake .. -DCMAKE_BUILD_TYPE=Release # Generate the makefile

		$ make # Compile it

		# make install # Install it

		# cd python && python setup.py install # optional: install the python bindings
Technical details
The analysis process works this way:
For every song analyzed, libbliss returns a struct song which contains, among other things,
four floats, each rating an aspect of the song:
- The tempo rating follows this paper until part II. A), in order to obtain a downsampled envelope of the whole song. The song's BPM are then
estimated by counting the number of peaks and dividing by the length of the song.
The period of each dominant beat can then be deduced from the frequencies, hinting at the song's tempo.
Warning: the tempo is not equal to the force of the song. As an example , a heavy metal track can have no steady beat at all, giving a very low tempo score while being very loud. - The amplitude rating reprents the physical « force » of the song, that is, how much the speaker's membrane will move in order to create the sound.
It is obtained by finding the right curvature pattern of the distribution of raw amplitudes. - The frequency rating is a ratio between high and low frequencies: a song with a lot of high-pitched sounds tends to wake humans up far more easily.
This rating is obtained by performing a DFT over the sample array, and splitting the resulting array in 4 frequency bands: low, mid-low, mid, mid-high, and high. Using the value in dB for each band, the final formula corresponds to freq_result = high + mid-high + mid - (low + mid-low) - The attack rating is just a sum of the intensity of all the attacks divided by the song's length.
As you have already guessed, a song with a lot of attacks also tends to wake humans up very quickly.
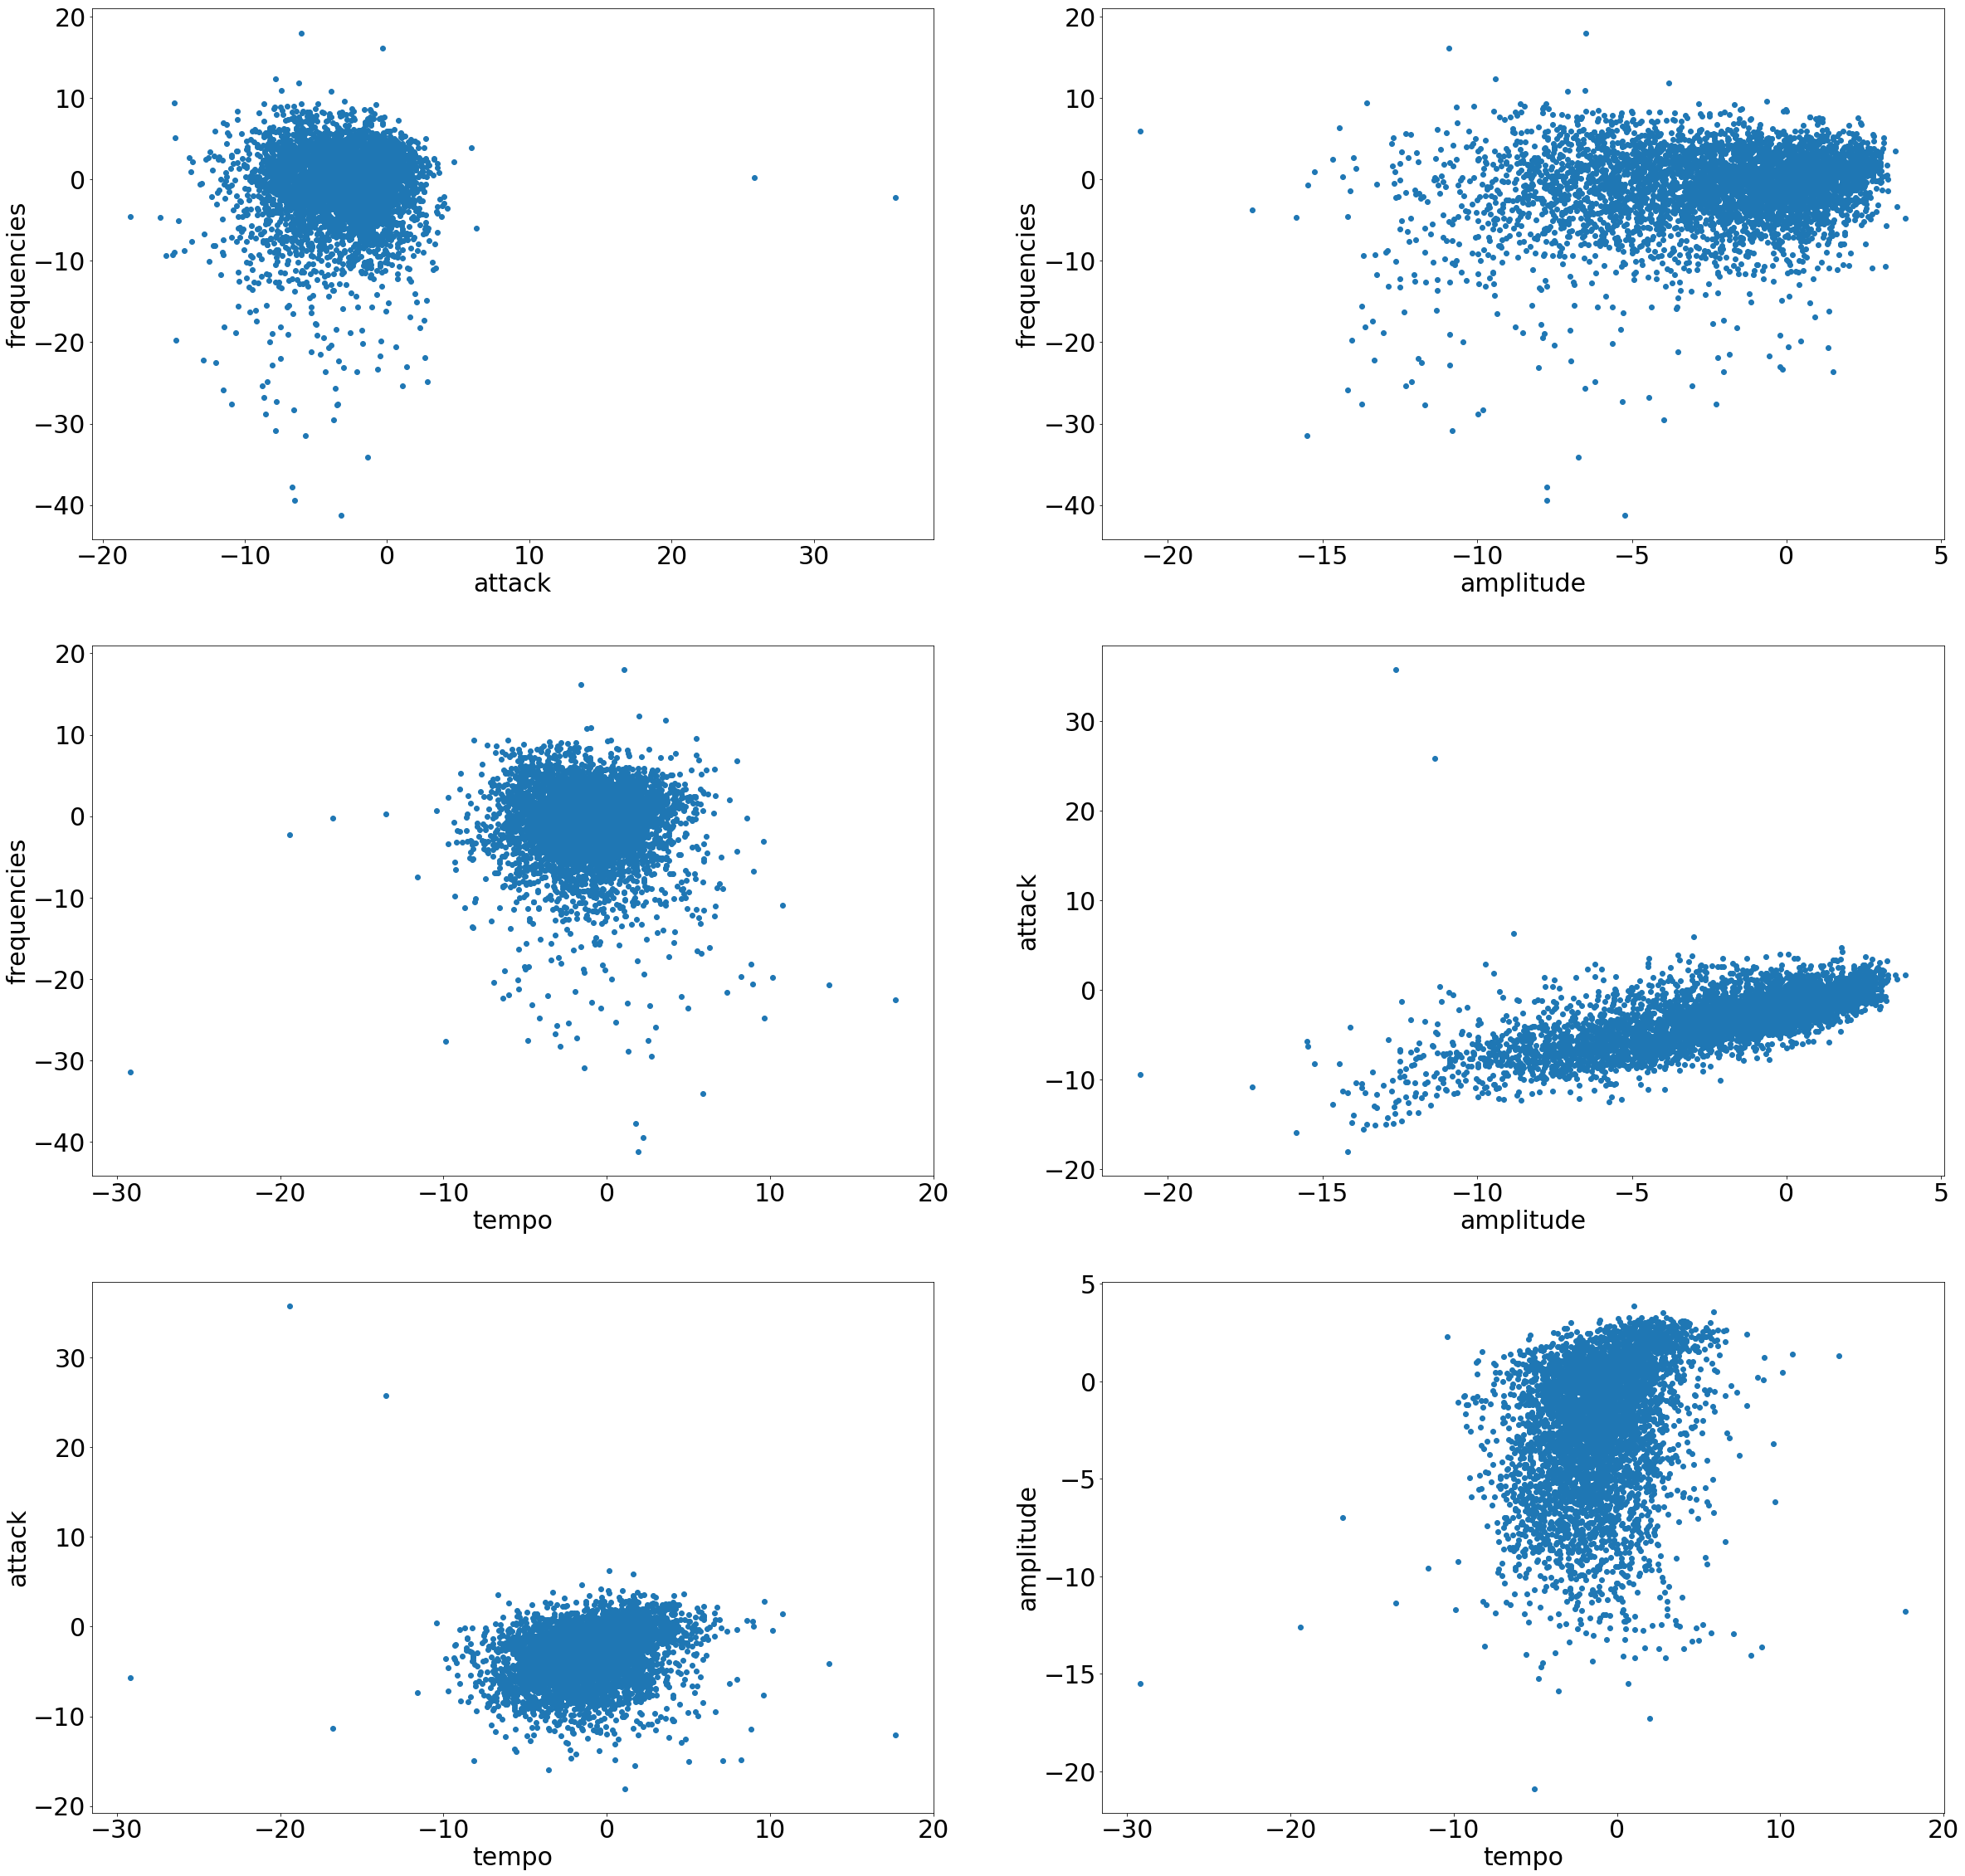
These ratings are supposed to be as disjoint as possible, to avoid any redundant feature.
However, there still seem to be some correlation between the amplitude / attack rating, as can be seen in this 2D-plot for ~4000 songs:
